
 EN
EN
 ar
ar bg
bg hr
hr cs
cs da
da nl
nl fi
fi fr
fr de
de el
el hi
hi it
it ko
ko no
no pl
pl pt
pt ro
ro ru
ru es
es sv
sv tl
tl iw
iw id
id lv
lv lt
lt sr
sr sk
sk sl
sl uk
uk vi
vi et
et hu
hu th
th tr
tr fa
fa ms
ms hy
hy ka
ka ur
ur bn
bn mn
mn ta
ta kk
kk uz
uz ku
ku
5G DTU
The platform supports graphical display so complex monitoring data can be converted into clearer visual information. Users can review trends, abnormal early warnings, and reports through a more intuitive interface. This is important because a raw table of readings is rarely enough for quick engineering management. Graphs, alarm status, project documents, and maintenance notes help users see what has changed and what needs attention. Kingmach 5G DTU is therefore positioned as a digital management layer above the field instruments.
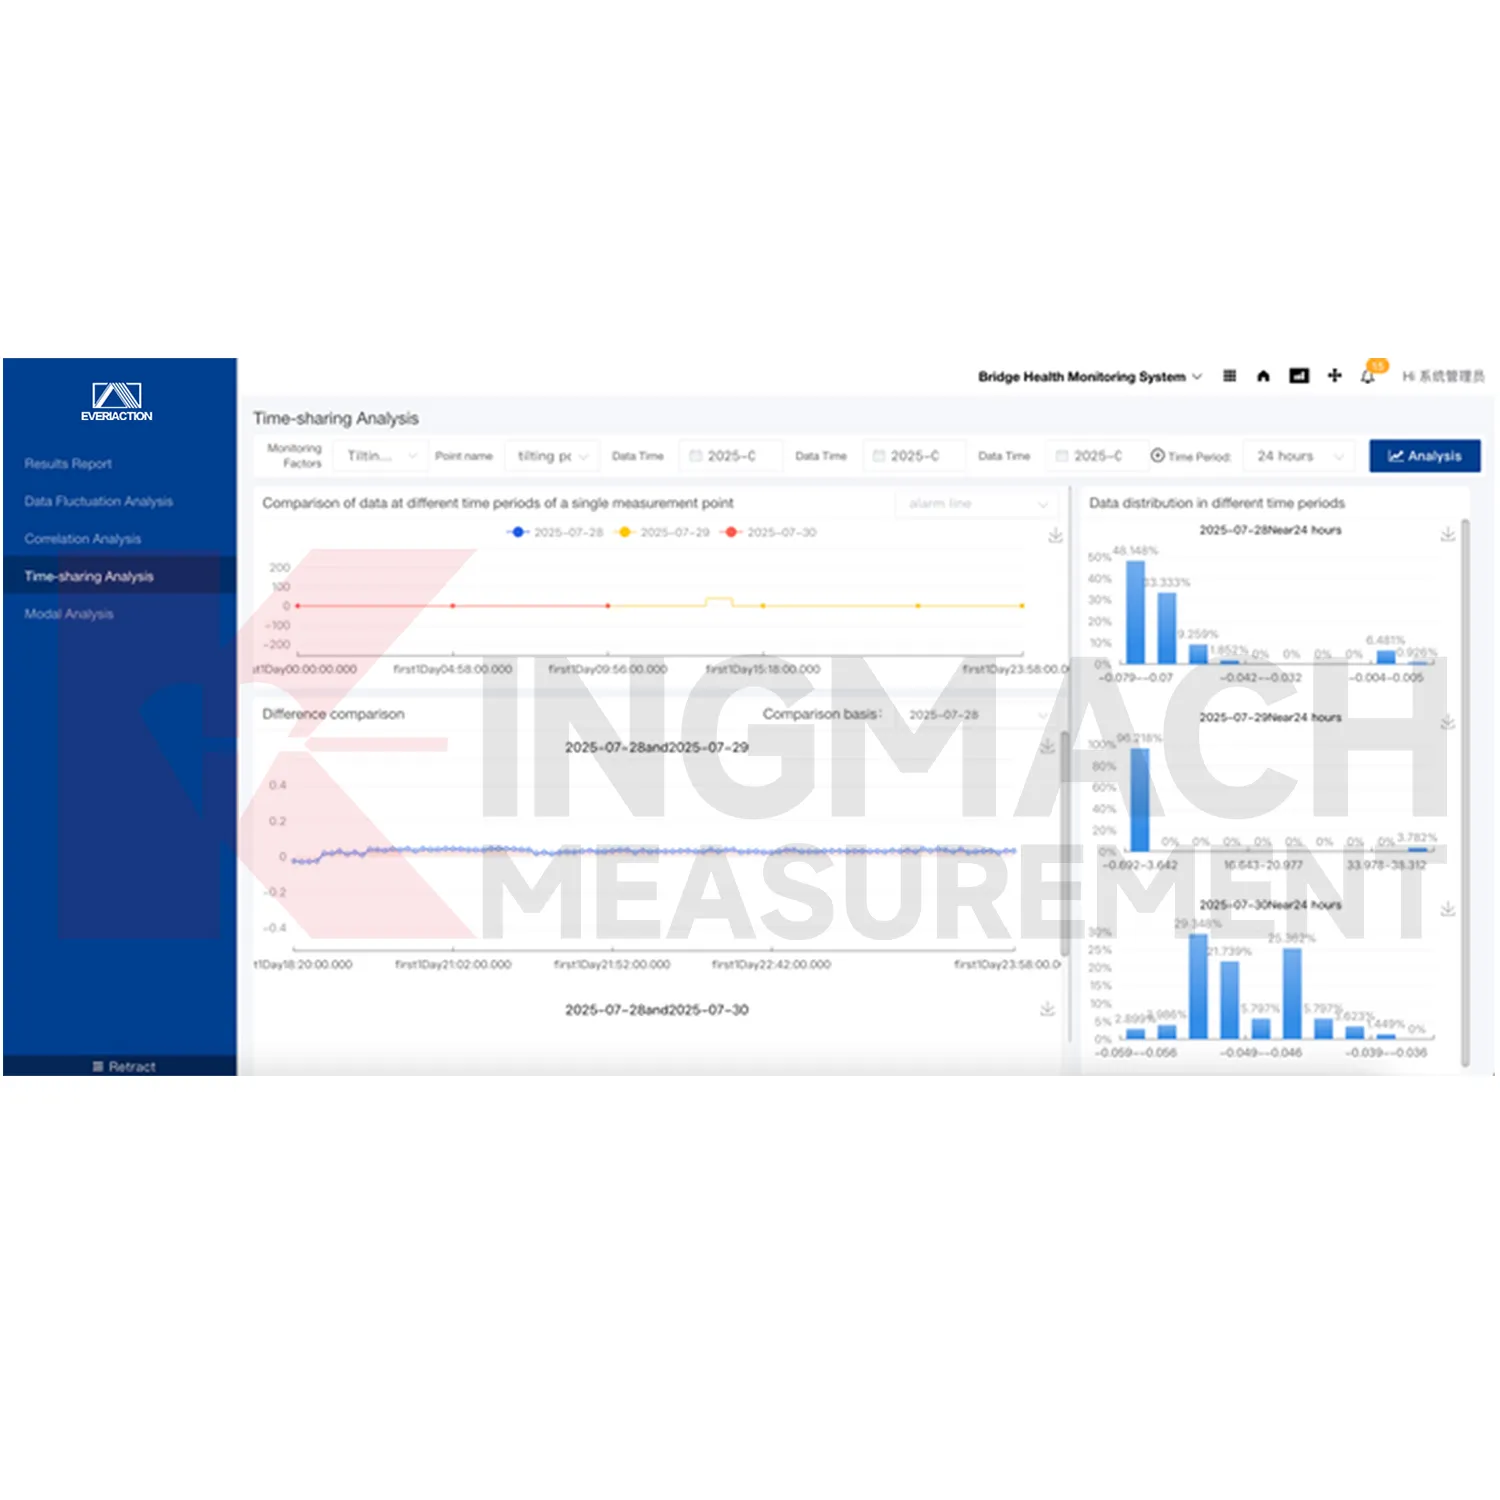
Application of 5G DTU
Environmental monitoring networks use Kingmach 5G DTU to connect rainfall, wind, temperature, humidity, water level, soil moisture, and related structural readings. Environmental data often explains why a structural channel changed. For example, rainfall may affect slope movement, temperature may affect strain readings, and water level may affect dam or foundation behavior. A shared platform helps reviewers see these relationships more clearly and prepare reports that include both the measured response and the surrounding condition.
The future of 5G DTU
Big data workflows will shape the future of Kingmach 5G DTU. Long-term structural monitoring creates large volumes of readings, alarms, inspection notes, and project documents. Raw storage alone is not enough; the platform must help filter, analyze, compare, visualize, and report those records. Over time, historical baselines will become more useful for judging whether a new event is ordinary, seasonal, construction-related, or abnormal. This makes data history an active part of engineering management.
Care & Maintenance of 5G DTU
After software updates or configuration changes, Kingmach 5G DTU should be checked with a short acceptance routine. Confirm device connections, data storage, trend display, alarm rules, report generation, user access, and project document links. Compare a few channels with field records or acquisition device values to make sure nothing shifted during the update. Record the date, change type, user, and verification result. This keeps platform maintenance visible in the project history.
Kingmach 5G DTU
The core value of Kingmach 5G DTU is not only display. It supports fast storage, real-time filtering, efficient analysis, complex statistics, user-friendly display, and personalized customization of collected data. These functions help convert raw sensor streams into information that can be reviewed by engineers and maintenance teams. A single abnormal point may need trend comparison, related channel review, inspection notes, and alarm history before action is taken. The platform gives those elements a common place, reducing the risk that important context is lost across separate files or devices.
FAQ
Q: What certification is listed?
A: The product information lists GB50982-2014 certification.
Q: What is the minimum order quantity?
A: The local product page lists one piece as the minimum order quantity.
Q: What is the delivery time?
A: Delivery time is listed as instant for the software platform.
Q: How is pricing handled?
A: Pricing is listed as negotiable, so project scope, configuration, and integration needs should be confirmed with Kingmach.
Q: What payment term is shown?
A: The local product page lists T/T in advance.
Reviews
Matthew Garcia
Instrumentation cables are durable and perform well even in harsh environments. Will definitely order again.
Joshua Clark
We ordered a full monitoring solution including sensors and data loggers. Everything works seamlessly together. Great supplier!
Latest Inquiries
To protect the privacy of our buyers, only public service email domains like Gmail, Yahoo, and MSN will be displayed. Additionally, only a limited portion of the inquiry content will be shown.
Harper***@gmail.comIndia
Dear Sir, we are planning to procure a complete monitoring system including strain gauges, tiltmeter...
Amelia***@gmail.comSingapore
Hello, I am looking for visualization software for monitoring system data analysis. Please let me kn...