 ar
ar bg
bg hr
hr cs
cs da
da nl
nl fi
fi fr
fr de
de el
el hi
hi it
it ko
ko no
no pl
pl pt
pt ro
ro ru
ru es
es sv
sv tl
tl iw
iw id
id lv
lv lt
lt sr
sr sk
sk sl
sl uk
uk vi
vi et
et hu
hu th
th tr
tr fa
fa ms
ms hy
hy ka
ka ur
ur bn
bn mn
mn ta
ta kk
kk uz
uz ku
ku
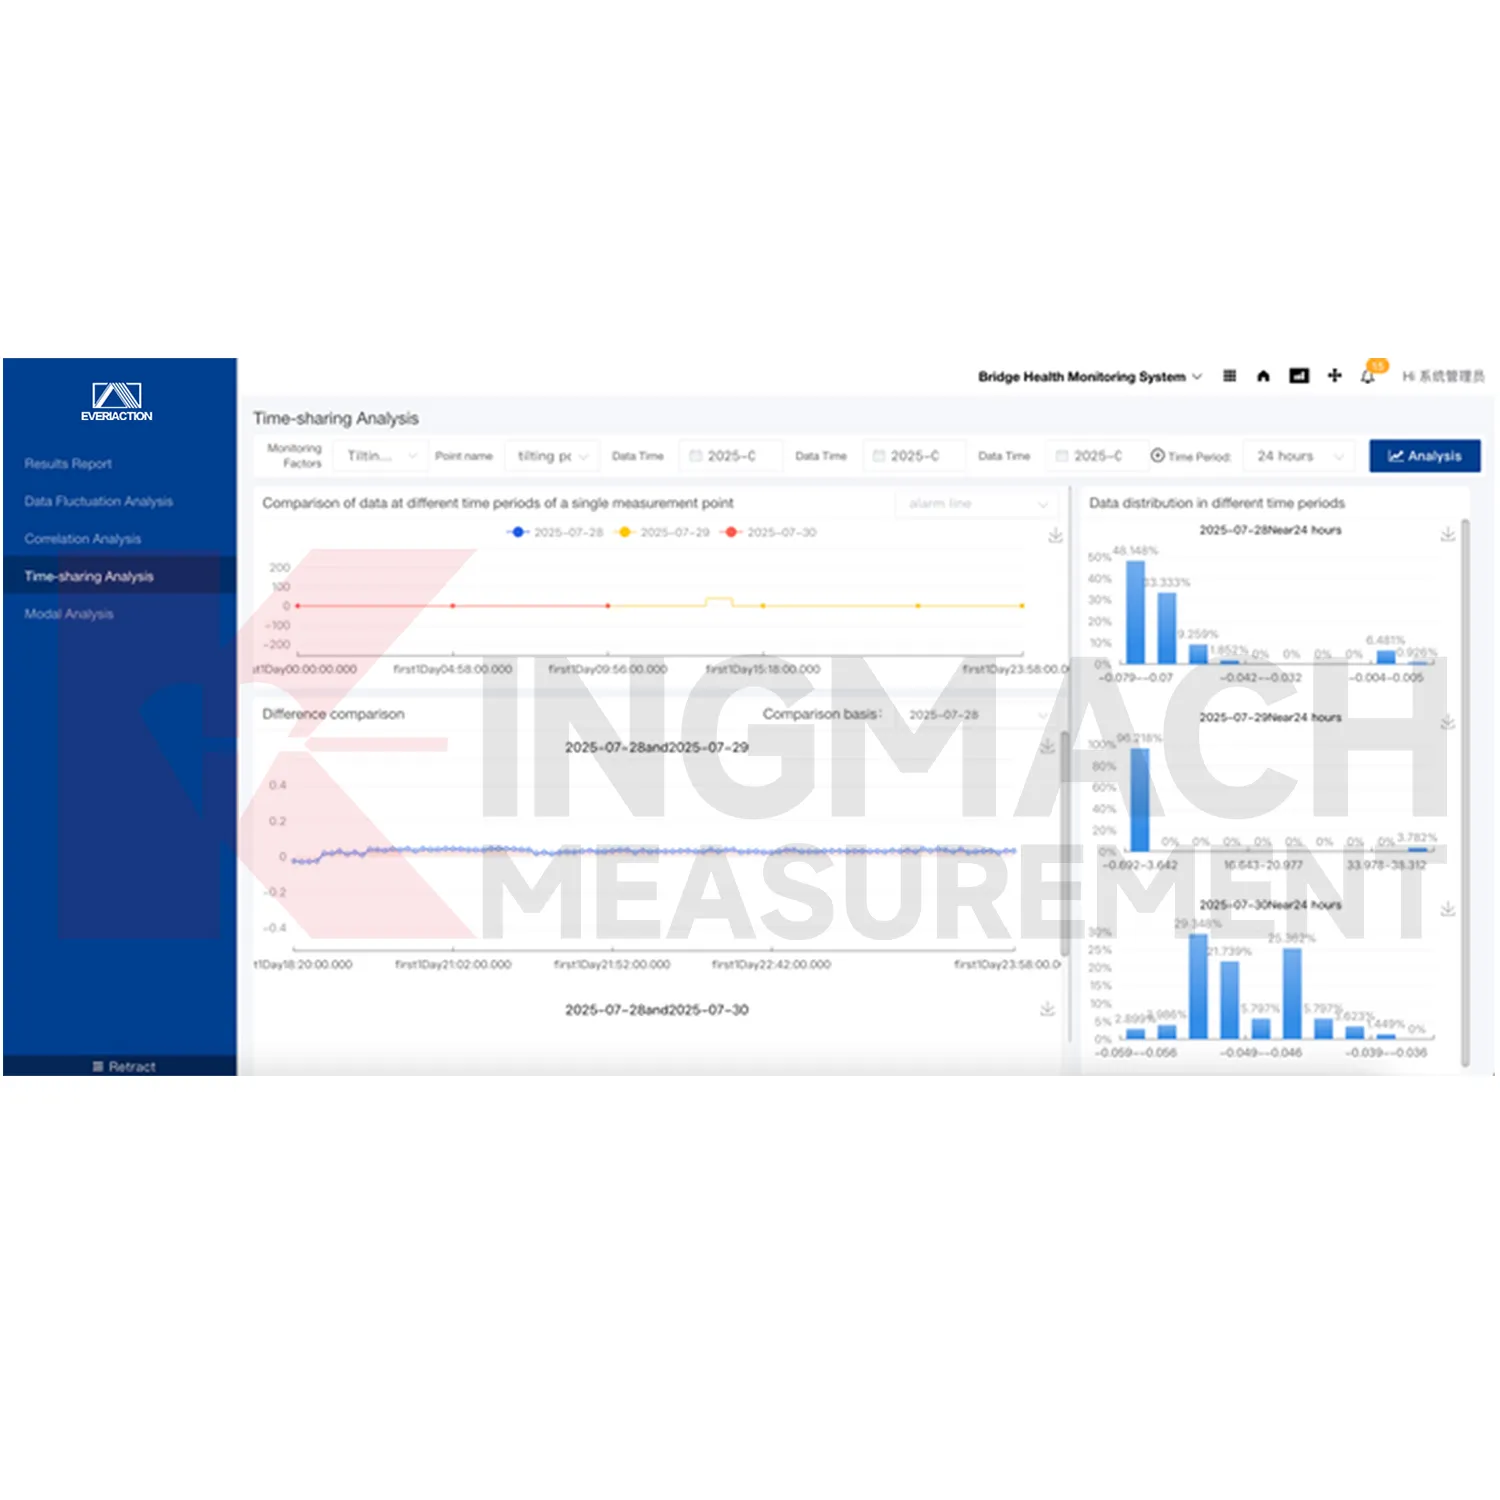
Visualization Software
After-sales and project support details in the local product file include efficient delivery for standard items when available, customized delivery per contract, warranty service for non-human-caused damage during the warranty period, and quick technical response. For a software platform, support matters because data integration, alarm configuration, report layout, user roles, and device access often need project-specific adjustment. Kingmach Visualization Software can therefore be planned as part of system deployment, not only as a display tool added after the sensors are installed.
Application of Visualization Software
Environmental monitoring networks use Kingmach Visualization Software to connect rainfall, wind, temperature, humidity, water level, soil moisture, and related structural readings. Environmental data often explains why a structural channel changed. For example, rainfall may affect slope movement, temperature may affect strain readings, and water level may affect dam or foundation behavior. A shared platform helps reviewers see these relationships more clearly and prepare reports that include both the measured response and the surrounding condition.
The future of Visualization Software
Cloud computing will support wider remote use of Kingmach Visualization Software. Owners and engineering teams may need to review assets from offices, field sites, control centers, or mobile workstations. Cloud-based access helps keep monitoring visible even when the structure is difficult to reach. Remote review will not replace field verification, but it can improve timing. Teams can identify which area needs inspection, what related data should be checked, and which documents should be prepared before arriving on site.
Care & Maintenance of Visualization Software
Backup and export planning protects Kingmach Visualization Software records. Monitoring data, alarm histories, reports, and project documents may be needed for maintenance, audits, claims, or engineering review years after collection. Define who can export data, how often backups are checked, and where report files are stored. If the platform is integrated with other systems, confirm that exported timestamps, units, point names, and alarm states remain readable outside the original view.
Kingmach Visualization Software
Kingmach Visualization Software is built around IoT, big data, and cloud computing technologies for civil engineering safety monitoring. Devices can transmit data to the Cloud Platform through wired or wireless means, allowing mixed field networks to feed a shared review environment. The platform is described as compatible with hardware devices from different manufacturers, different types, and different models. This is useful for owners who already have existing instruments or who need to expand a site in stages. The software layer helps connect new and old monitoring equipment into one readable data environment.
FAQ
Q: What certification is listed?
A: The product information lists GB50982-2014 certification.
Q: What is the minimum order quantity?
A: The local product page lists one piece as the minimum order quantity.
Q: What is the delivery time?
A: Delivery time is listed as instant for the software platform.
Q: How is pricing handled?
A: Pricing is listed as negotiable, so project scope, configuration, and integration needs should be confirmed with Kingmach.
Q: What payment term is shown?
A: The local product page lists T/T in advance.
Reviews
Joshua Clark
We ordered a full monitoring solution including sensors and data loggers. Everything works seamlessly together. Great supplier!
Robert Taylor
The weir flow meter is well-built and delivers accurate measurements. Great value for water management applications.
Latest Inquiries
To protect the privacy of our buyers, only public service email domains like Gmail, Yahoo, and MSN will be displayed. Additionally, only a limited portion of the inquiry content will be shown.
Ava***@gmail.comAustralia
Hi, I am looking for reliable tiltmeters and accelerometers for structural health monitoring. Please...
Charlotte***@gmail.comUnited Arab Emirates
Hi, we require instrumentation cables suitable for harsh environments. Could you advise on specifica...
Related product categories
- Monitoring Software Suite
- Monitoring system software platform
- Environmental Monitoring
- Visualization Software
- GPS Displacement Monitoring System
- Integrated Monitoring Station
- Settlement Monitoring Rod
- Structural Health Monitoring (SHM) System
- Structural Monitoring Cloud Platform
- IoT Online Monitoring System
- Monitoring System Platform & Services
- Engineering Pulse Intelligent Monitoring Cloud Platform