 ar
ar bg
bg hr
hr cs
cs da
da nl
nl fi
fi fr
fr de
de el
el hi
hi it
it ko
ko no
no pl
pl pt
pt ro
ro ru
ru es
es sv
sv tl
tl iw
iw id
id lv
lv lt
lt sr
sr sk
sk sl
sl uk
uk vi
vi et
et hu
hu th
th tr
tr fa
fa ms
ms hy
hy ka
ka ur
ur bn
bn mn
mn ta
ta kk
kk uz
uz ku
ku
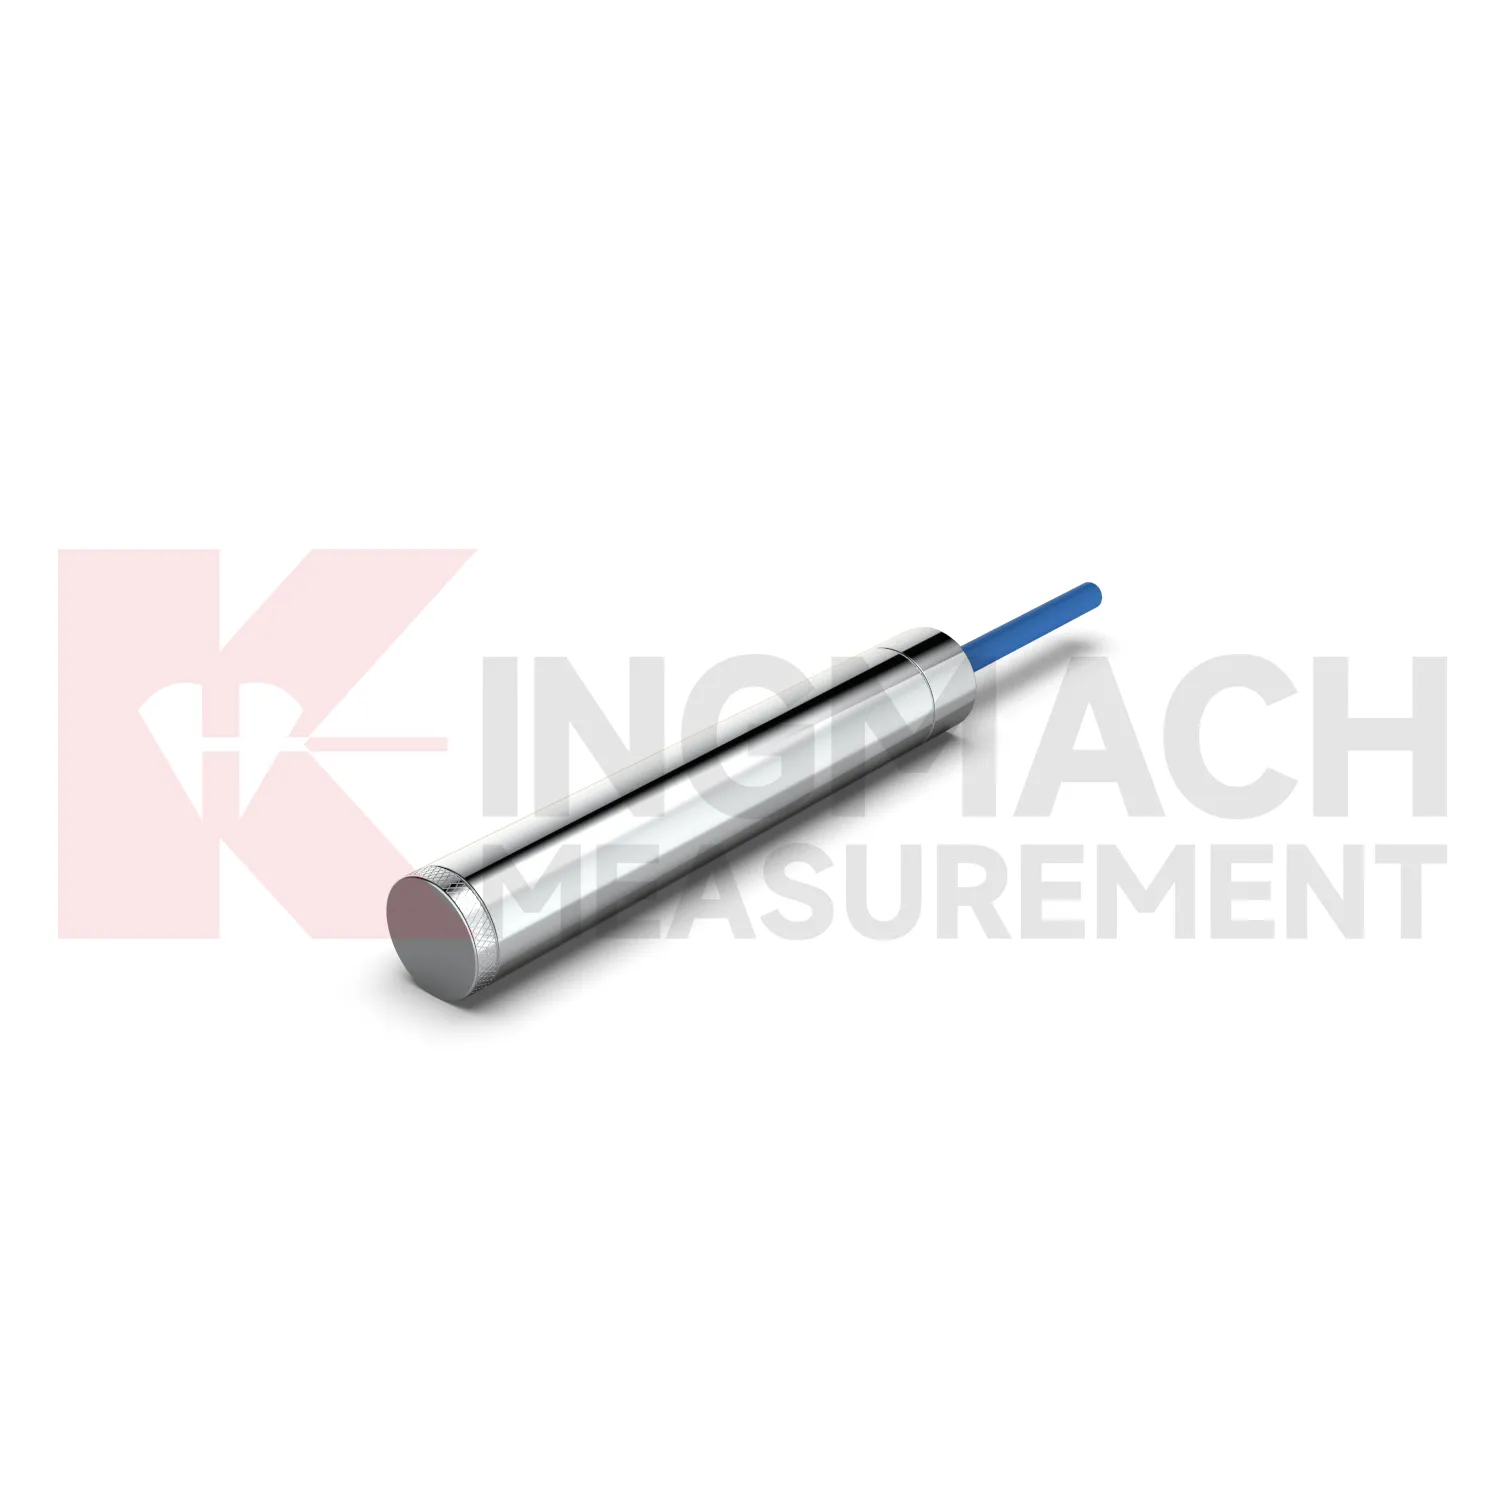
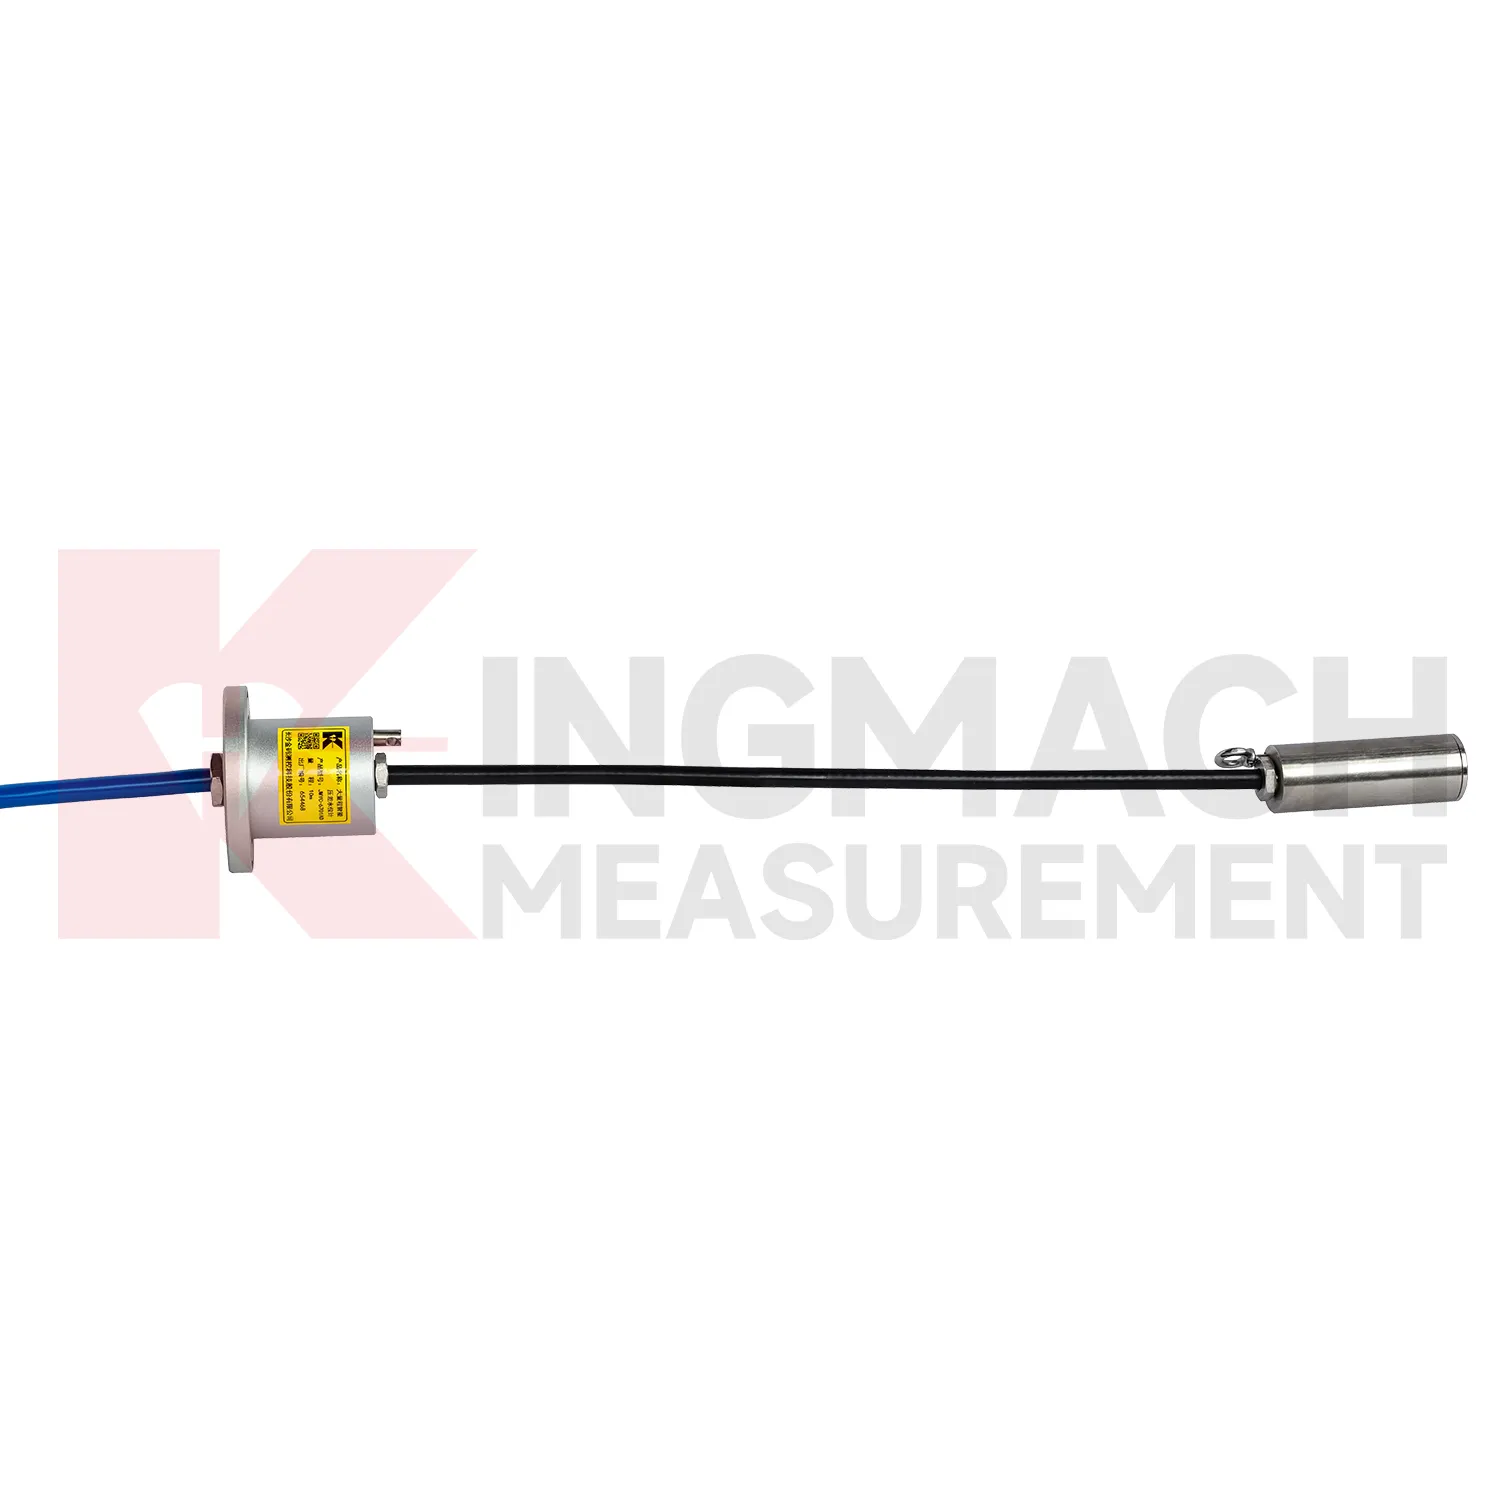
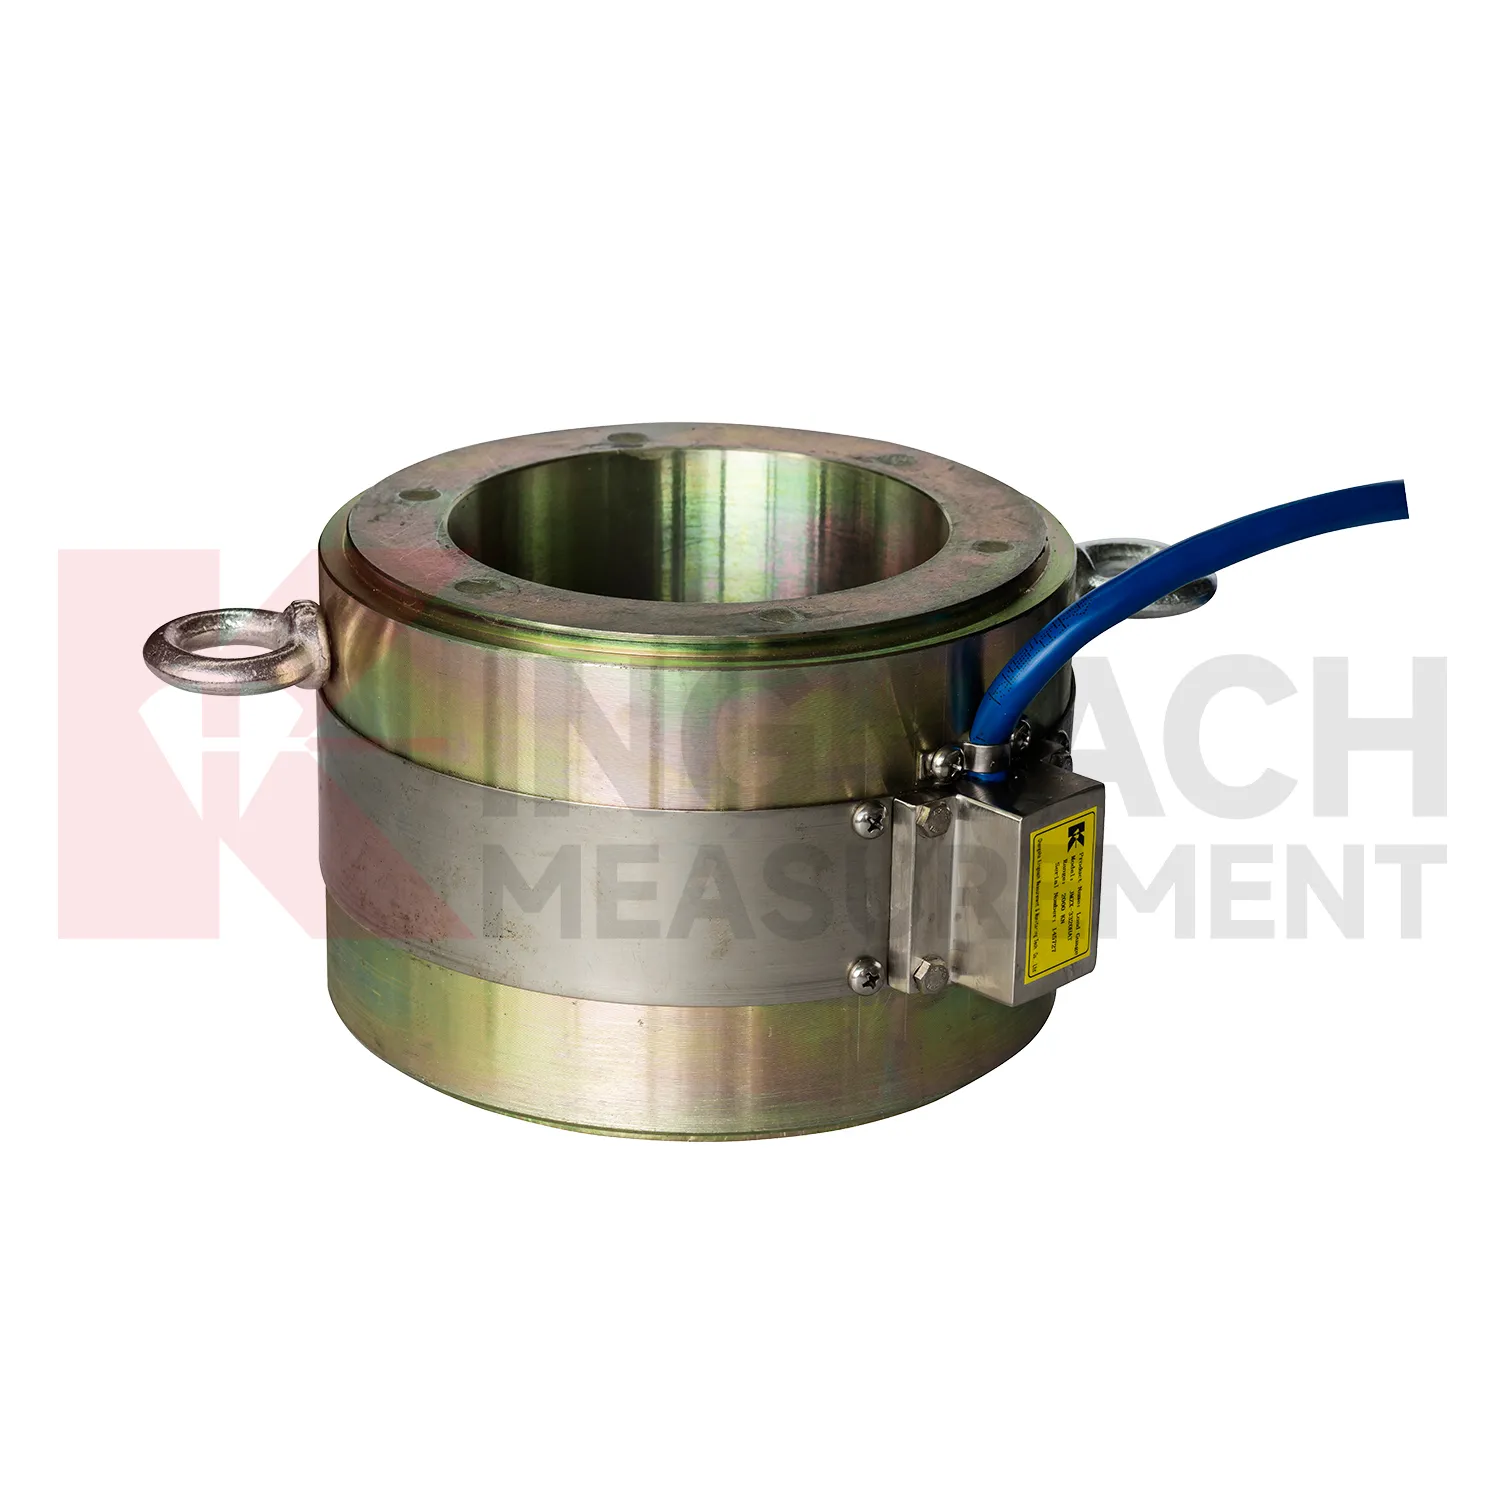
load cell connection diagram
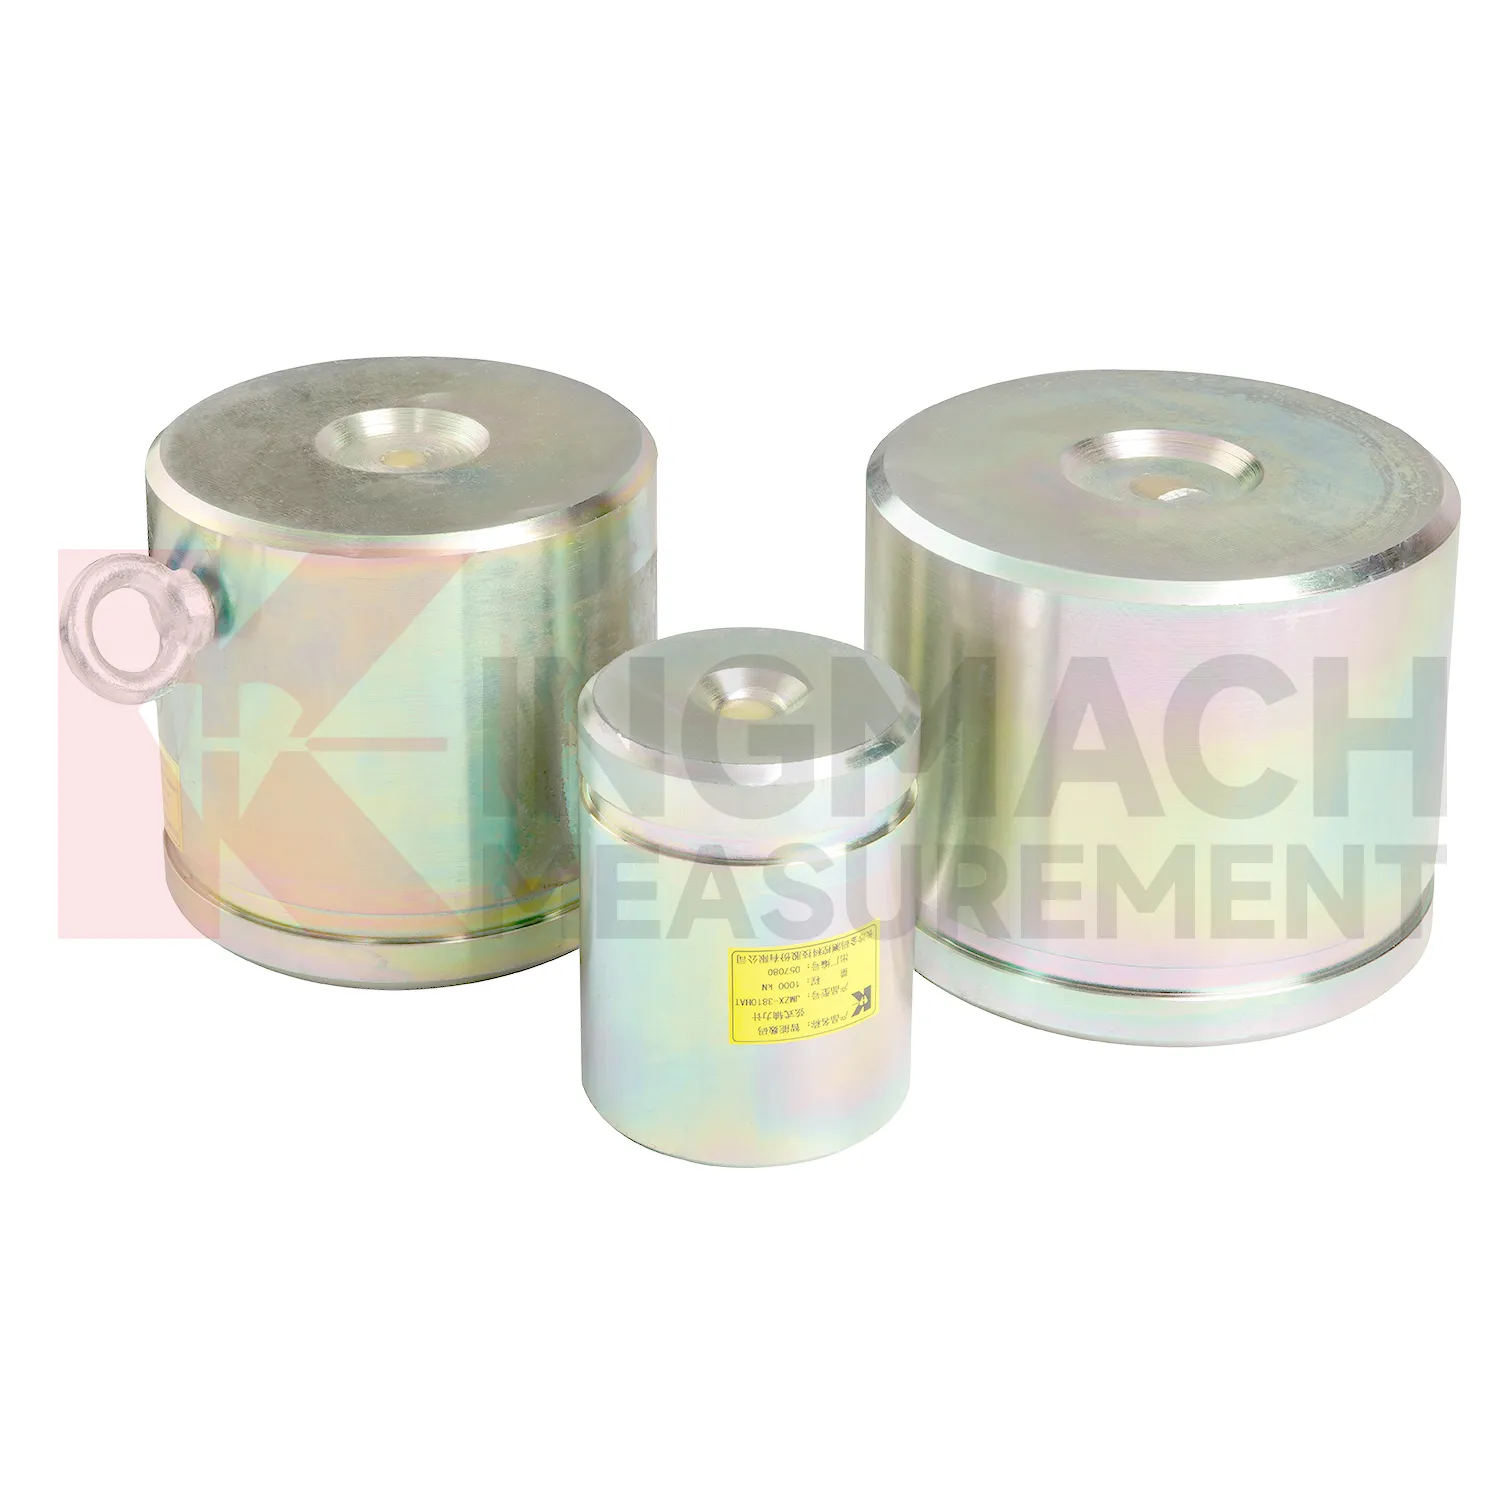
Kingmach load cell connection diagram product information is especially helpful during early engineering review because it gives model families rather than one generic device. The JMZX-3XXXHAT hollow load cell is tied to annular multi-string construction, elastic steel, ultra-high-strength vibrating wires, anchor welding, temperature correction, and 500 kN to 8000 kN ranges. The JMZX-35XXHAT solid load cell is tied to compression monitoring, 1000 kN to 10000 kN ranges, 0.1 kN resolution, and 0.5%FS precision. The JMZX-38XXHAT axial force meter is tied to steel support measurement, 200 kN to 3000 kN ranges, and 1 MPa waterproof performance. Those distinctions guide model selection before purchase. For a bridge, the force path may require hollow or solid construction. For a tunnel support, direct axial force display may be more practical. For soil pressure, MPa range and buried durability matter more than kN capacity. Matching the type to the load path prevents expensive changes after delivery. The product pages also show that standard models and customized versions may exist side by side. That is important because site geometry, force range, and available clearance may require confirmation before the load point can be ordered with confidence. It also gives the contractor clearer limits for installation geometry, cable routing, waterproof protection, and calibration review before the work reaches the field.
Application of load cell connection diagram
In pile load testing and bearing capacity verification, load cell connection diagram helps track applied force, load stages, unloading response, and residual behavior. The common problem is uncertainty around whether the applied load is centered and whether the recorded value matches the actual force passing through the test system. Kingmach solid load cells such as JMZX-35XXHAT list 1000 kN to 10000 kN ranges, 0.1 kN resolution, and 0.5%FS precision, with overload information listed as 20 to 50%F.S. range overload and 300 to 400%F.S. failure overload. These figures suit heavy test work when capacity margin must be checked before the sensor is installed. During the test, the record should include each loading step, hold time, unloading step, zero check, temperature, and any change to the bearing arrangement. Pairing the load record with settlement readings gives a clearer view of pile response. After the test, the documented calibration coefficient and instrument identity help keep the acceptance file defensible. Test reports should also record jack pressure, settlement response, load rate, hold duration, and any adjustment to the reaction system. These records help engineers identify whether an unusual load value came from the pile, the loading setup, or the measurement chain.
The future of load cell connection diagram
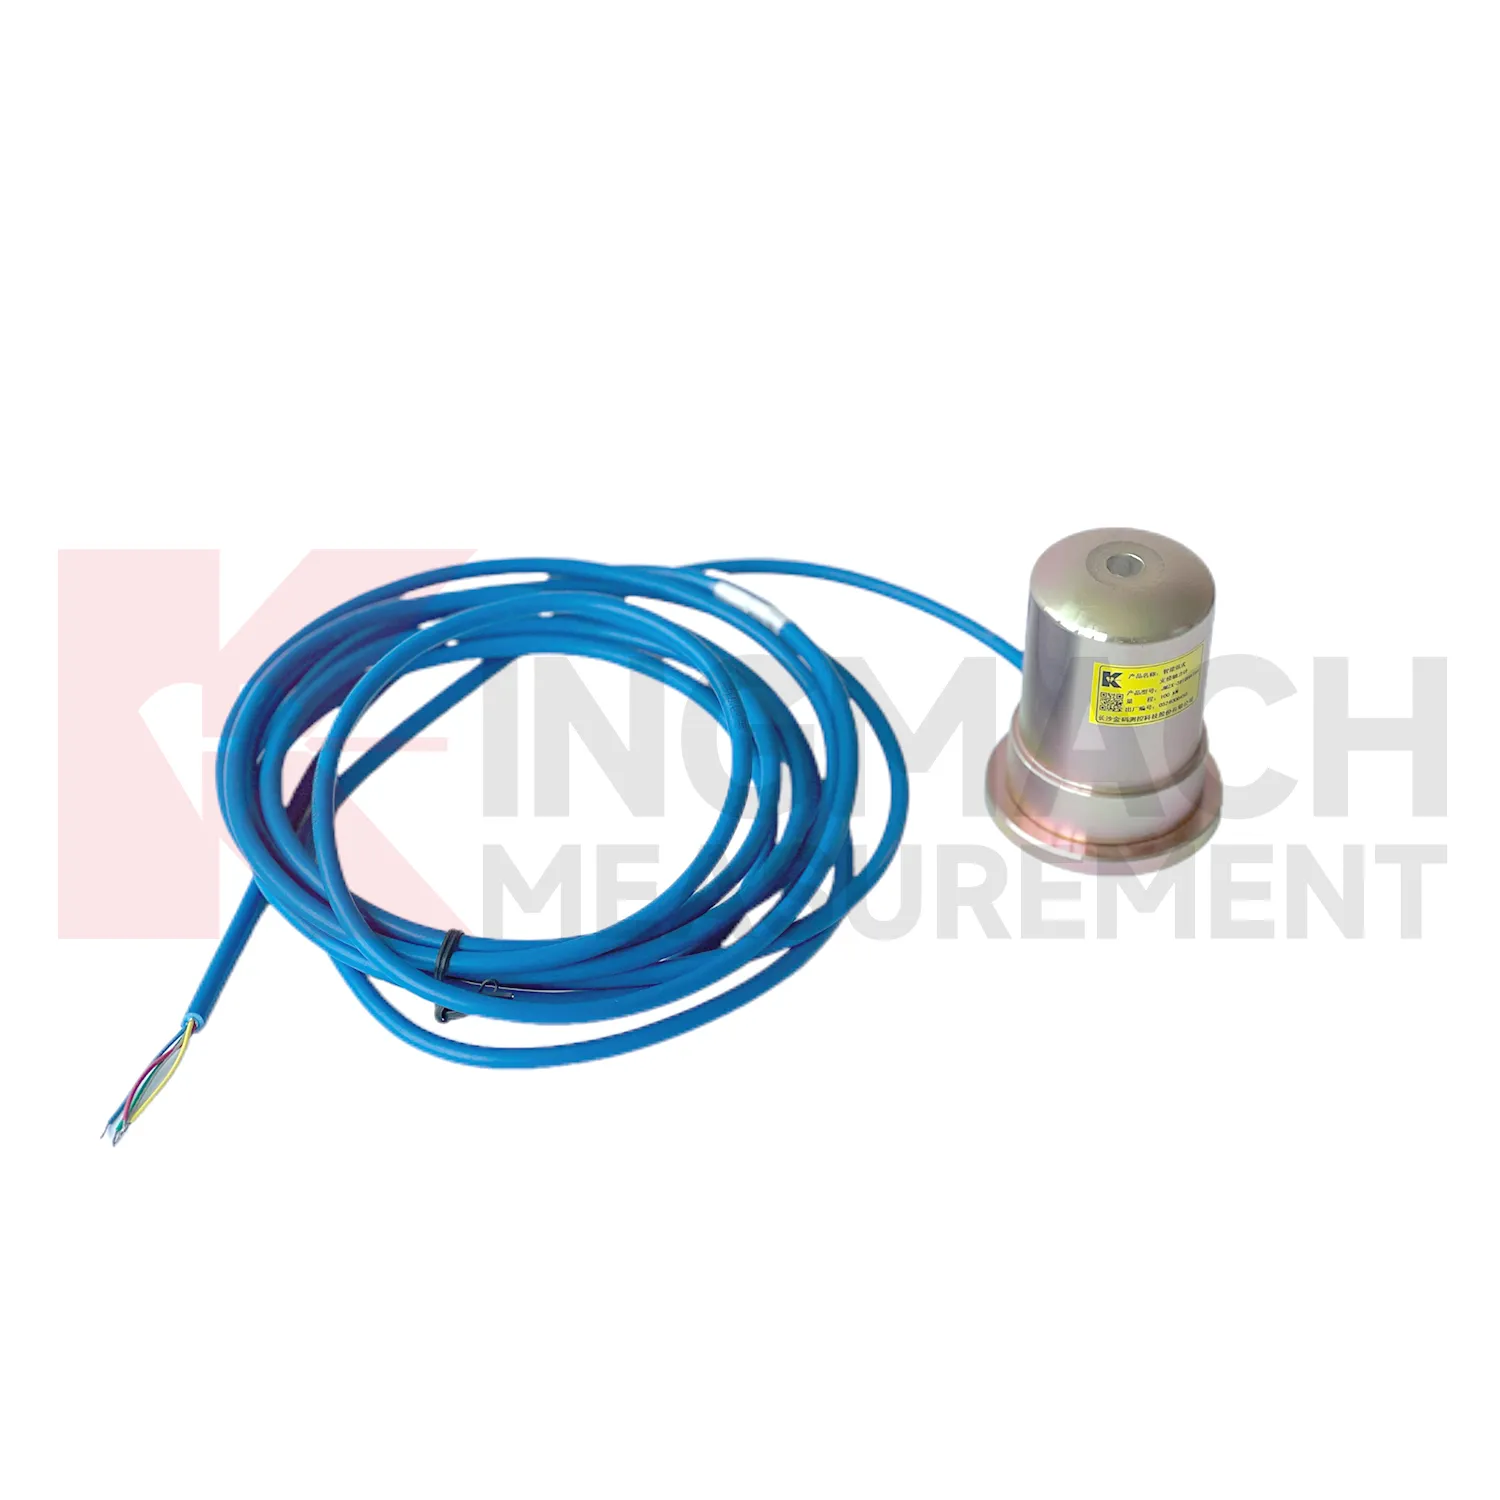
The next stage for load cell connection diagram in infrastructure monitoring is tighter integration with site data systems. Smart sensors already store model data, calibration coefficients, zero values, temperature readings, and measurement records on selected Kingmach products. The practical path is to connect that identity data with 4G, LoRa, wired acquisition, or 5G gateways, then place the force trend beside displacement, settlement, pore pressure, and rainfall in the same review screen. This matters because future warnings will be less about one limit value and more about patterns: force rising after excavation, anchor load falling after heavy rain, or bridge cable force drifting during seasonal temperature cycles. Digital twin models can use those readings when the sensor location, range, and calibration background are reliable. Standards and owner specifications for structural health monitoring are also becoming more data traceability focused, which favors instruments that can carry their own calibration identity and remain readable through long service periods.
Care & Maintenance of load cell connection diagram
For load cell connection diagram installed in foundation pits or tunnels, the maintenance routine must fit a fast changing site. Axial force meters may cover 200 kN to 3000 kN with 0.5%FS accuracy and direct kN display, while earth pressure cells may cover 0.3 MPa to 8 MPa with 0.001 MPa resolution. During installation, confirm that steel support surfaces have enough thickness and strength, and add buffer plates where stress concentration is possible. Protect the sensor body and cable from equipment impact, cutting, concrete splash, and standing water. During excavation, check readings after each major stage rather than waiting for a fixed calendar date. If a channel becomes unstable, inspect the cable route, connector, readout, and temperature condition first. Long term points should have waterproof labels, photo records, and clear channel mapping. Sudden changes should be compared with wall movement, settlement, water pressure, and site work before any conclusion is recorded.
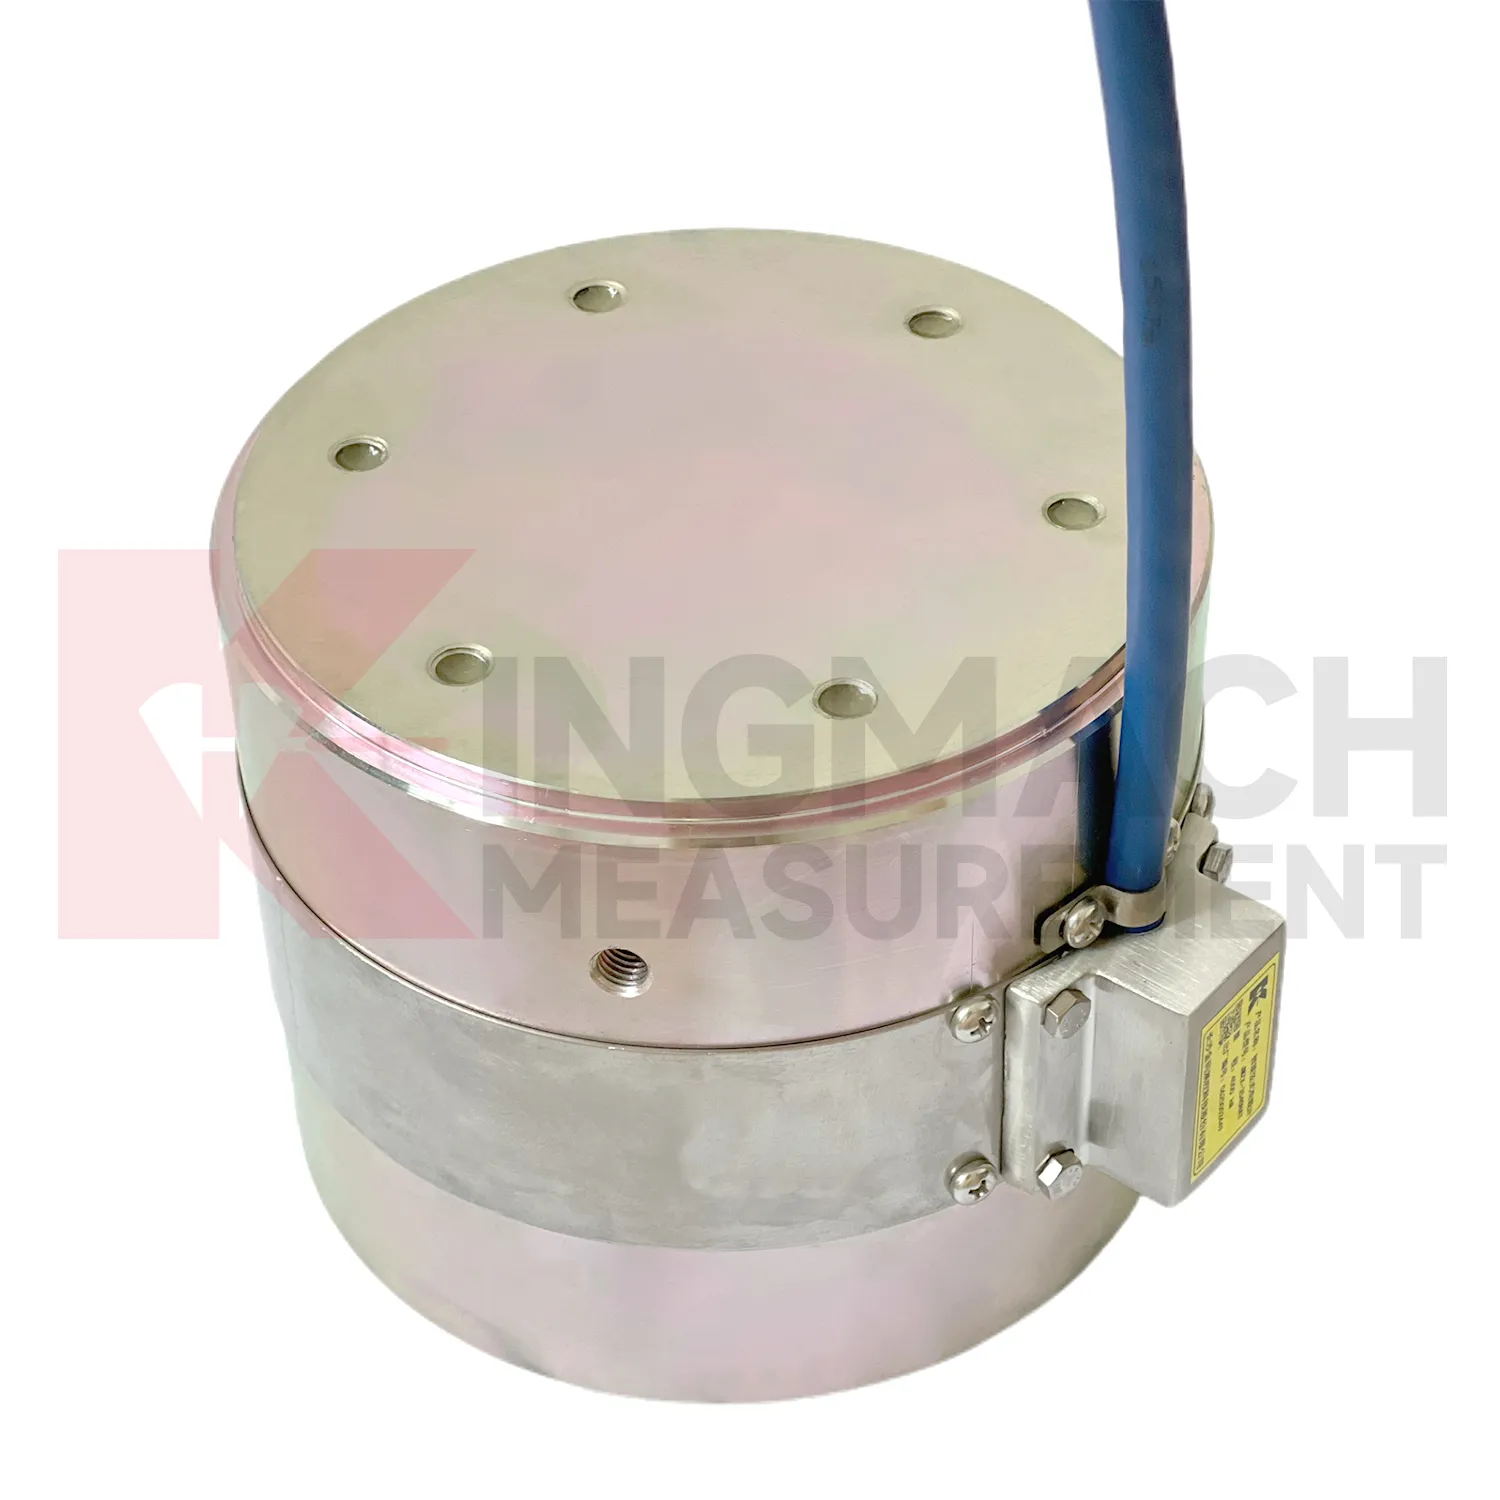
Kingmach load cell connection diagram
load cell connection diagram gives engineering teams a way to follow load behavior without dismantling the structure. In bridge bearing checks, anchor testing, steel support monitoring, pile tests, and retaining wall pressure work, the measured force can change before cracks, settlement, or visible deformation become obvious. Kingmach product information points to vibrating wire and smart sensing designs, built-in memory, automatic temperature correction, waterproof construction, and direct force display on selected models. These features matter because site readings are often taken by different people across long periods. The instrument needs to preserve its identity and calibration background even when the reading method changes from manual inspection to automated collection. The most useful force record is modest but complete: point name, model, range, coefficient, temperature, cable condition, acquisition channel, and the event that preceded the reading. That is enough to make later engineering review much less speculative. It also helps inspectors decide whether a changed value needs field checking or simple trend review.
FAQ
Q: How should load cell connection diagram be selected for a bridge cable or anchor point? A: Start with expected force, lock-off load, possible overload, bearing geometry, and access for later inspection. Hollow load cells are commonly used where the anchor or cable passes through the center opening. Q: What range information is available from Kingmach hollow models? A: The JMZX-3XXXHAT series is listed from 500 kN to 8000 kN, with 0.1 kN sensitivity on the 500 kN model and 1 kN on larger listed models. Q: Why does temperature correction matter? A: Cable and anchor readings can move with temperature, so built-in temperature measurement helps reduce false interpretation. Q: Can readings be stored inside the sensor? A: Smart hollow models list storage for 800 measurement records, including time, temperature, zero values, and correction data. Q: What should be checked after installation? A: Check seating, cable protection, connector sealing, zero value, first stable force, and matching channel name.
Reviews
Robert Taylor
The weir flow meter is well-built and delivers accurate measurements. Great value for water management applications.
Ryan Lewis
Fast delivery and excellent product quality. The accelerometers and tiltmeters are highly reliable. Strongly recommend this company.
Latest Inquiries
To protect the privacy of our buyers, only public service email domains like Gmail, Yahoo, and MSN will be displayed. Additionally, only a limited portion of the inquiry content will be shown.
Olivia***@gmail.comUnited States
Hello, we are currently sourcing high-precision strain gauges and load cells for a bridge monitoring...
Mia***@gmail.comNetherlands
Dear team, we are interested in your readouts & data loggers compatible with multiple sensors. Do yo...